End-to-end IoT with Fathym IoT Ensemble
January 25, 2021 by Michael Gearhardt, CTO @ Fathym
Connecting Raspberry Pi/DHT11, Node Red, and Power BI with IoT Ensemble
For many, the Internet of Things (IoT) can seem like a difficult challenge, especially thinking through getting an end-to-end IoT Solution out the door (or stood up for the first time). In this post, we'll take you step-by-step through the process of setting up your own personal temperature sensor with IoT Ensemble. Here's a look at what we'll do:
- Configure and set up a Raspberry Pi
- Connect a temperature sensor
- Read the data with Node-Red
- Use IoT Ensemble to stream sensor data
- Leverage helpful data tools from your dashboard
- Visualize your data with PowerBI
This may seem like a lot, and can take some teams weeks or even months. So grab your gear, and we'll have you up and running in the next 30 - 60 minutes.
Things you will need
In this walk through, we use the Model 3B Raspberry Pi (but you can use a Model 4 as well) and a DHT11 sensor. If you're like me, you may have as many as 3 or more Raspberry Pis laying around your house. Mix this with a multitude of sensors and starter kits, and you'll quickly get a sense for why my wife made me move to the garage.
If this is you, dust off an RPi and if you don't have a DHT11, grab another sensor and make the necessary adjustments when we hook up Node Red. If that isn't you or you're somewhere in between, you may have to make a few quick purchases and gather some supplies:
- Raspberry Pi with a Power Source
- MicroSD card, at least 16GB
- DHT11 humidity/temperature sensor w/ wires
- A Fathym IoT Ensemble account (we’re using the free, shared version)
- Power BI Desktop
- A USB Keyboard and mouse
- A computer monitor
- Your normal computer with an SD card reader (or you can buy an SD to USB dongle)
note
If you want to move forward without the physical device, you can still see what the end-to-end IoT experience looks like by leveraging our emulated data. Simply enable the emulated data and follow instructions in connecting to emulated data in the cold query API.
Part 1: Setting up the Raspberry Pi
This process includes putting the Raspberry Pi Operating System (formerly known as Raspbian) onto your micro SD card and interacting with the Pi to complete initial setup (Connect to Wifi, allow permissions to access your Pi from another computer, etc).
The official Raspberry Pi website has an excellent tool called the Raspberry Pi Imager, which walks you through the process of creating an SD card that will power and control your Raspberry PI.
note
For more information on the RPi imager, read here.
Now that you have your SD card ready to go, we can fire up the Pi! You will need to plug your keyboard and mouse into 2 of the 4 USB inputs on the Pi, and plug in a monitor with an HDMI cable.
Once all peripherals are connected, plug in the power source and connect it to the Pi. This should open the Raspberry Pi OS first time setup wizard on the monitor. Navigate through the provided steps, which will include connecting the Pi to WiFi.
note
More information on that wizard process can be found here. You can skip over the Recommended Software portion if desired, it is not important to this tutorial
Part 2 - Installing Software on the Raspberry Pi
After completing the setup steps in Part 1, you will be taken to the main Raspberry Pi desktop. In the top left, click on the Raspberry logo, which will show a drop down of options. Click on the Programming tab, then click Terminal.
In order to program our Pi and get connected, we will need to install a couple of tools first, mainly Node.js and Node-Red by completing the following terminal commands:
- To update the system package list run
sudo apt-get update - Install the latest versions of system packages with
sudo apt-get dist-upgrade - Get the Node.js package we need to install by running
curl -sL https://deb.nodesource.com/setup_current.x | sudo -E bash - To install the Node.js package
sudo apt-get install -y nodejs - Finally download and install Node Red with command
bash <(curl -sL https://raw.githubusercontent.com/node-red/linux-installers/master/deb/update-nodejs-and-nodered)
Once all commands have been run in the terminal, the RPi is setup with Node Red.
note
For more advanced users, there is an option to control your Raspberry Pi remotely using SSH, instead of using a monitor, keyboard and mouse. More information and instructions can be found here.
Part 3 - Wire up the DHT11 Sensor
Next, we need to wire up the DHT11 sensor to the Raspberry Pi. Thankfully, this simple sensor doesn’t need any complex wiring, resistors, or breadboards. Simply follow the wiring diagram provided below:
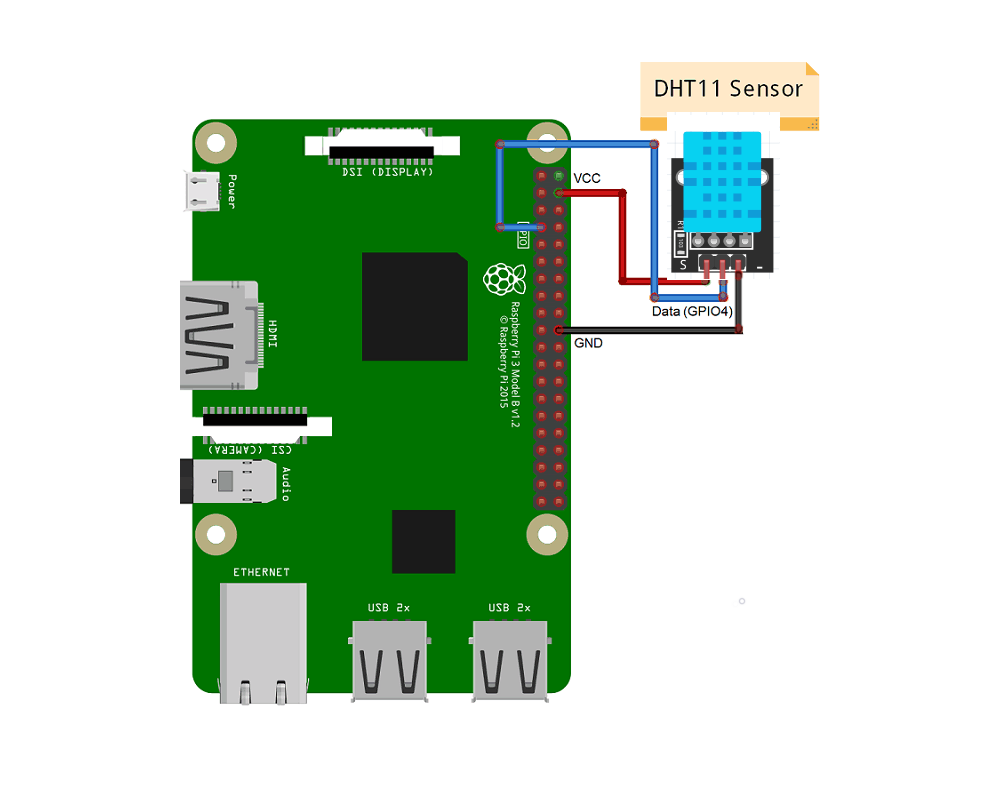
The GPIO pins allow the Raspberry Pi to control and monitor the outside world by being connected to electronic circuits. It's important to be aware of which pin is which. The DHT11 Sensor has been wired as follows:
- DHT11 Positive – Pi PIN 4 (Power)
- DHT11 Negative – Pi PIN 20 (Ground)
- DHT11 Out – Pi PIN 7 (Data)
note
You can check here for more information on other pin configurations for your sensors and equipment.
Part 4 - Using Node-Red to Read Sensor Data
Once you’re done wiring your sensor, go back to your terminal window on the Raspberry Pi. Then enter the command node-red-start which will start the node red service. When the service starts, the terminal will look similar to this:
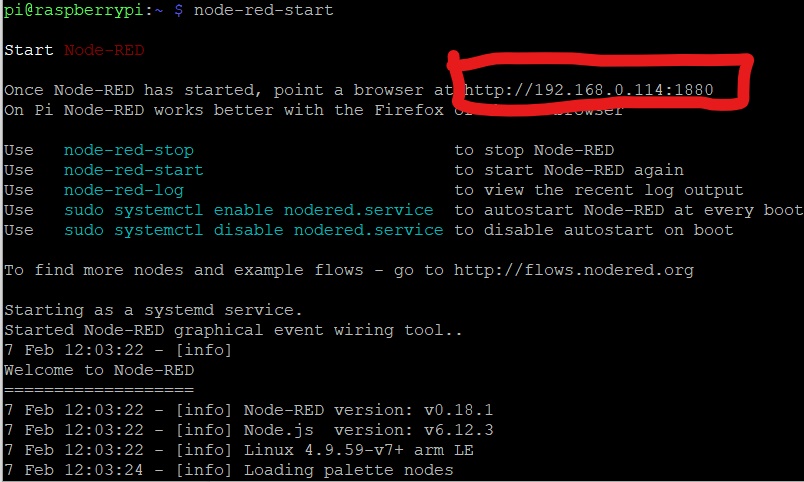
In the top right, there will be a URL that usually starts with 'http://192…' (inside the red box above). You can then use the built in Raspberry Pi web browser to navigate to this website. You will then be taken to a screen that looks like this:
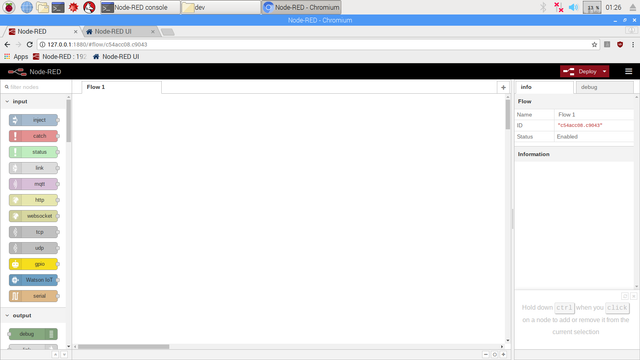
Welcome to Node-Red! There are a few additional modules that we will need in order to create our device flow. In the top right corner of the screen, click on the ![]() , and then click Manage palette. On the new screen, click on the Install tab. In the search bar, type in the following and install each of them:
, and then click Manage palette. On the new screen, click on the Install tab. In the search bar, type in the following and install each of them:
- node-red-contrib-azure-iot-hub
- node-red-contrib-dht-sensor
For the sake of simplicity, we are able to import previously created flows into Node Red. The following flow template takes temperature and humidity information from the DHT11, formats the JSON payload to use IoT Ensemble's Best Practice Schema (in addition, uses a few extra fields like key and protocol to work with the Azure IoT Hub module), and takes a reading every 30 seconds. To use this template, copy the following Node-Red JSON template:
[{"id":"e97f8ba8.2829d8","type":"tab","label":"DHT11 Sensor with Raspberry Pi to Fathym IoT Ensemble","disabled":false,"info":"This simple flow is designed to get basic temperature and humidity readings into Fathym's IoT Ensemble dashboard"},{"id":"2fe1190e.141286","type":"inject","z":"e97f8ba8.2829d8","name":"Take reading every 30 seconds","props":[{"p":"payload"}],"repeat":"30","crontab":"","once":true,"onceDelay":0.1,"topic":"","payload":"","payloadType":"date","x":190,"y":440,"wires":[["2f3407d4.26b858"]]},{"id":"2f3407d4.26b858","type":"rpi-dht22","z":"e97f8ba8.2829d8","name":"DHT11 Sensor","topic":"","dht":"11","pintype":"0","pin":4,"x":500,"y":440,"wires":[["1fa2f6c2.9637b9"]]},{"id":"1fa2f6c2.9637b9","type":"change","z":"e97f8ba8.2829d8","name":"Format JSON","rules":[{"t":"set","p":"payload","pt":"msg","to":"{\t\t\"deviceId\": \"Your DeviceID\",\t\t\"key\": \"Your Device Key\",\t\t\"protocol\": \"mqtt\",\t\t\"data\": {\t\t\"DeviceID\": \"Your DeviceID\",\t\t\"DeviceData\": {\t\t\t\"Latitude\": \"40.5853° N\",\t\t\t\"Longitude\": \"105.0844° W\"\t\t},\t\t\"SensorReadings\": {\t\t\t\"Temperature\": $number(payload),\t\t\t\"Humidity\": $number(humidity)\t\t},\t\t\"SensorMetadata\": {\t\t\t\"_\": {\t\t\t\t\"SignalStrength\": \"Good\",\t\t\t\t\"SensorType\": \"DHT11\"\t\t\t}\t\t}\t\t}\t}","tot":"jsonata"}],"action":"","property":"","from":"","to":"","reg":false,"x":760,"y":440,"wires":[["8601cbe1.84e998","fc1e92ea.2210b"]]},{"id":"8601cbe1.84e998","type":"debug","z":"e97f8ba8.2829d8","name":"Local Debug","active":true,"tosidebar":true,"console":false,"tostatus":false,"complete":"payload","targetType":"msg","statusVal":"","statusType":"auto","x":970,"y":380,"wires":[]},{"id":"fc1e92ea.2210b","type":"azureiothub","z":"e97f8ba8.2829d8","name":"Azure IoT Hub","protocol":"mqtt","x":980,"y":500,"wires":[[]]}]
In the Node-Red browser screen, click on the ![]() at the top right of the screen, and choose Import. Paste the JSON into the text box, and click Import. You will now have a visual representation of the flow of data from the device.
at the top right of the screen, and choose Import. Paste the JSON into the text box, and click Import. You will now have a visual representation of the flow of data from the device.
note
If you chose to use a sensor other than the DHT11, you can still start from the provided template. Once the template is imported, you can work with Node Red to swap out the dht-sensor for the one you chose. Node Red packages for your devices can be found by searching here.
Before we start sending actual device readings, we first need to provide Node Red some device configuration information. This is where IoT Ensemble comes in!
Part 5 - Configuring IoT Ensemble
Before we can tell your device where to send data, we first need somewhere to send the data. There are a number of different ways this can be accomplished, with IoT Ensemble the focus is helping you leverage best practice cloud IoT technology. Here we'll be using the Azure IoT Hub to connect devices to a shared data flow, and then make it avaiable downstream for use in other applications.
Follow these steps to create a new device in IoT Ensemble. For more details on the full IoT Ensemble experience, check out our full documentation.
Start by navigating to the IoT Ensemble Dashboard and sign in or sign up. For the purposes of moving forward, you will only need the Free license and no credit card will be required.
Enroll a Device
In the Connected Devices section, click the Enroll New Device button, provide a name for your device (i.e. my-first-device) and click Enroll Device. That’s it! Your device is now registered and should be visible in the dashboard, along with its associated connection string.

Click on the ![]() button to copy your connection string to your clipboard. Your connection string should look something like this:
button to copy your connection string to your clipboard. Your connection string should look something like this:
HostName=YourHostName;DeviceId=YourDeviceID;SharedAccessKey=YourDeviceKey
Within the connection string, there are three key parts that we need: The HostName, the DeviceID, and the SharedAccessKey. All of these values need to be a part of either the data payload, or as a config value. Let's add them now.
Update Node Red
Copy YourHostName, YourDeviceID and YourDeviceKey portions of your connection string (not including the "Hostname=", "DeviceId=", "SharedAccessKey=", or the ";" at the end of each value). Go back to your Node-Red browser, and double click on the yellow Format JSON module, which will pull up a Properties screen, shown below.
Next, click on the three-dot menu screen (shown in the red box below). This will pull up an "Edit" screen for your flow.
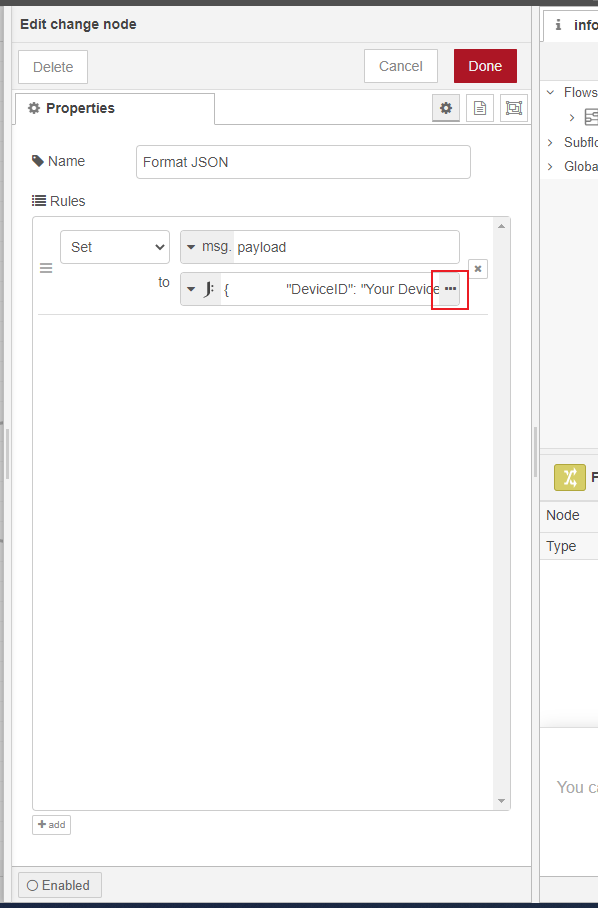
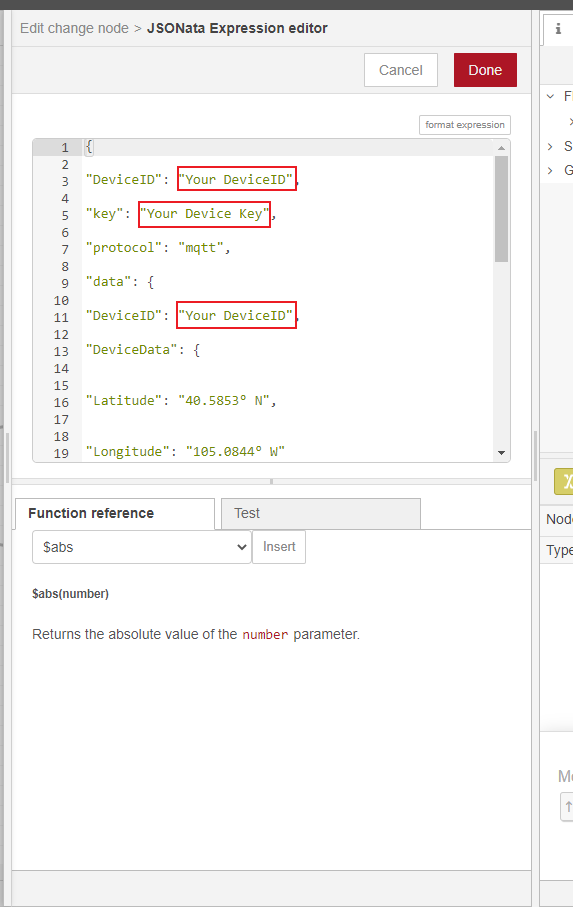
From here, take the YourDeviceID and YourDeviceKey values from your connection string and paste them into the properties shown in the red boxes below. Click Done, and then Done again to close the module properties screen.
note
For this specific example, DeviceID has to be entered twice. This is because the Azure IoT Hub module requires the DeviceID in order to build a connection string. The IoT Hub itself also requires a DeviceID in the data payload.
Next, double click on the "Azure IoT Hub" node module. This will open a Properties screen, shown below. Take your HostName, and paste it into the red box shown above. Click Done, and then Done again to close the module properties screen.
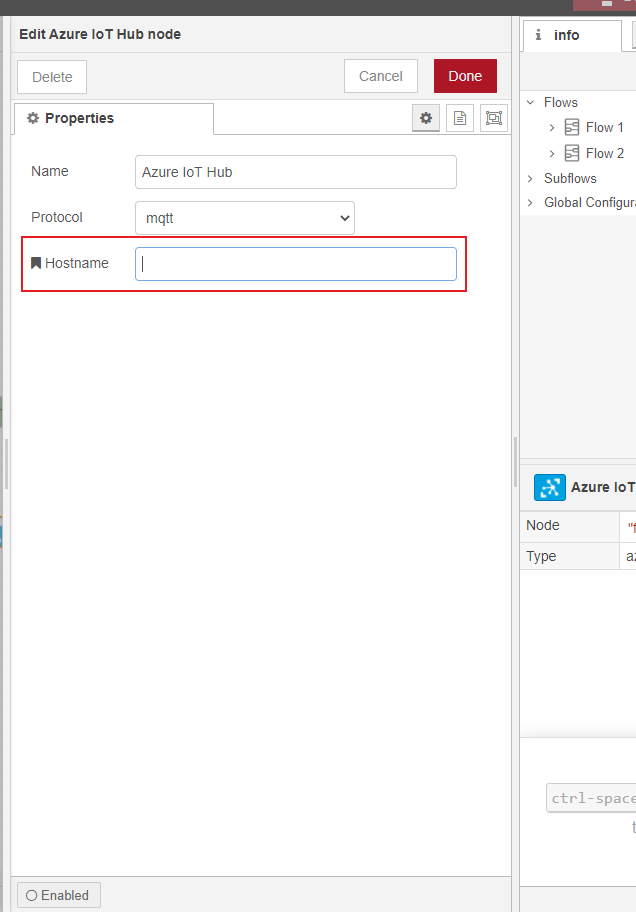
Once this is complete, click the red Deploy button in the top right corner. Your Pi is now sending real time data to IoT Ensemble! Simply enable live telemetry and investigate your data.

Part 6 - Connecting Data to Power BI Desktop
There are a lot of options in Power BI Desktop for importing data to be used in reports and visualizations for data interpretation. IoT Ensemble provides connection URLs and Storage Access Keys so you can import data from your devices into Power BI using the Web data source.
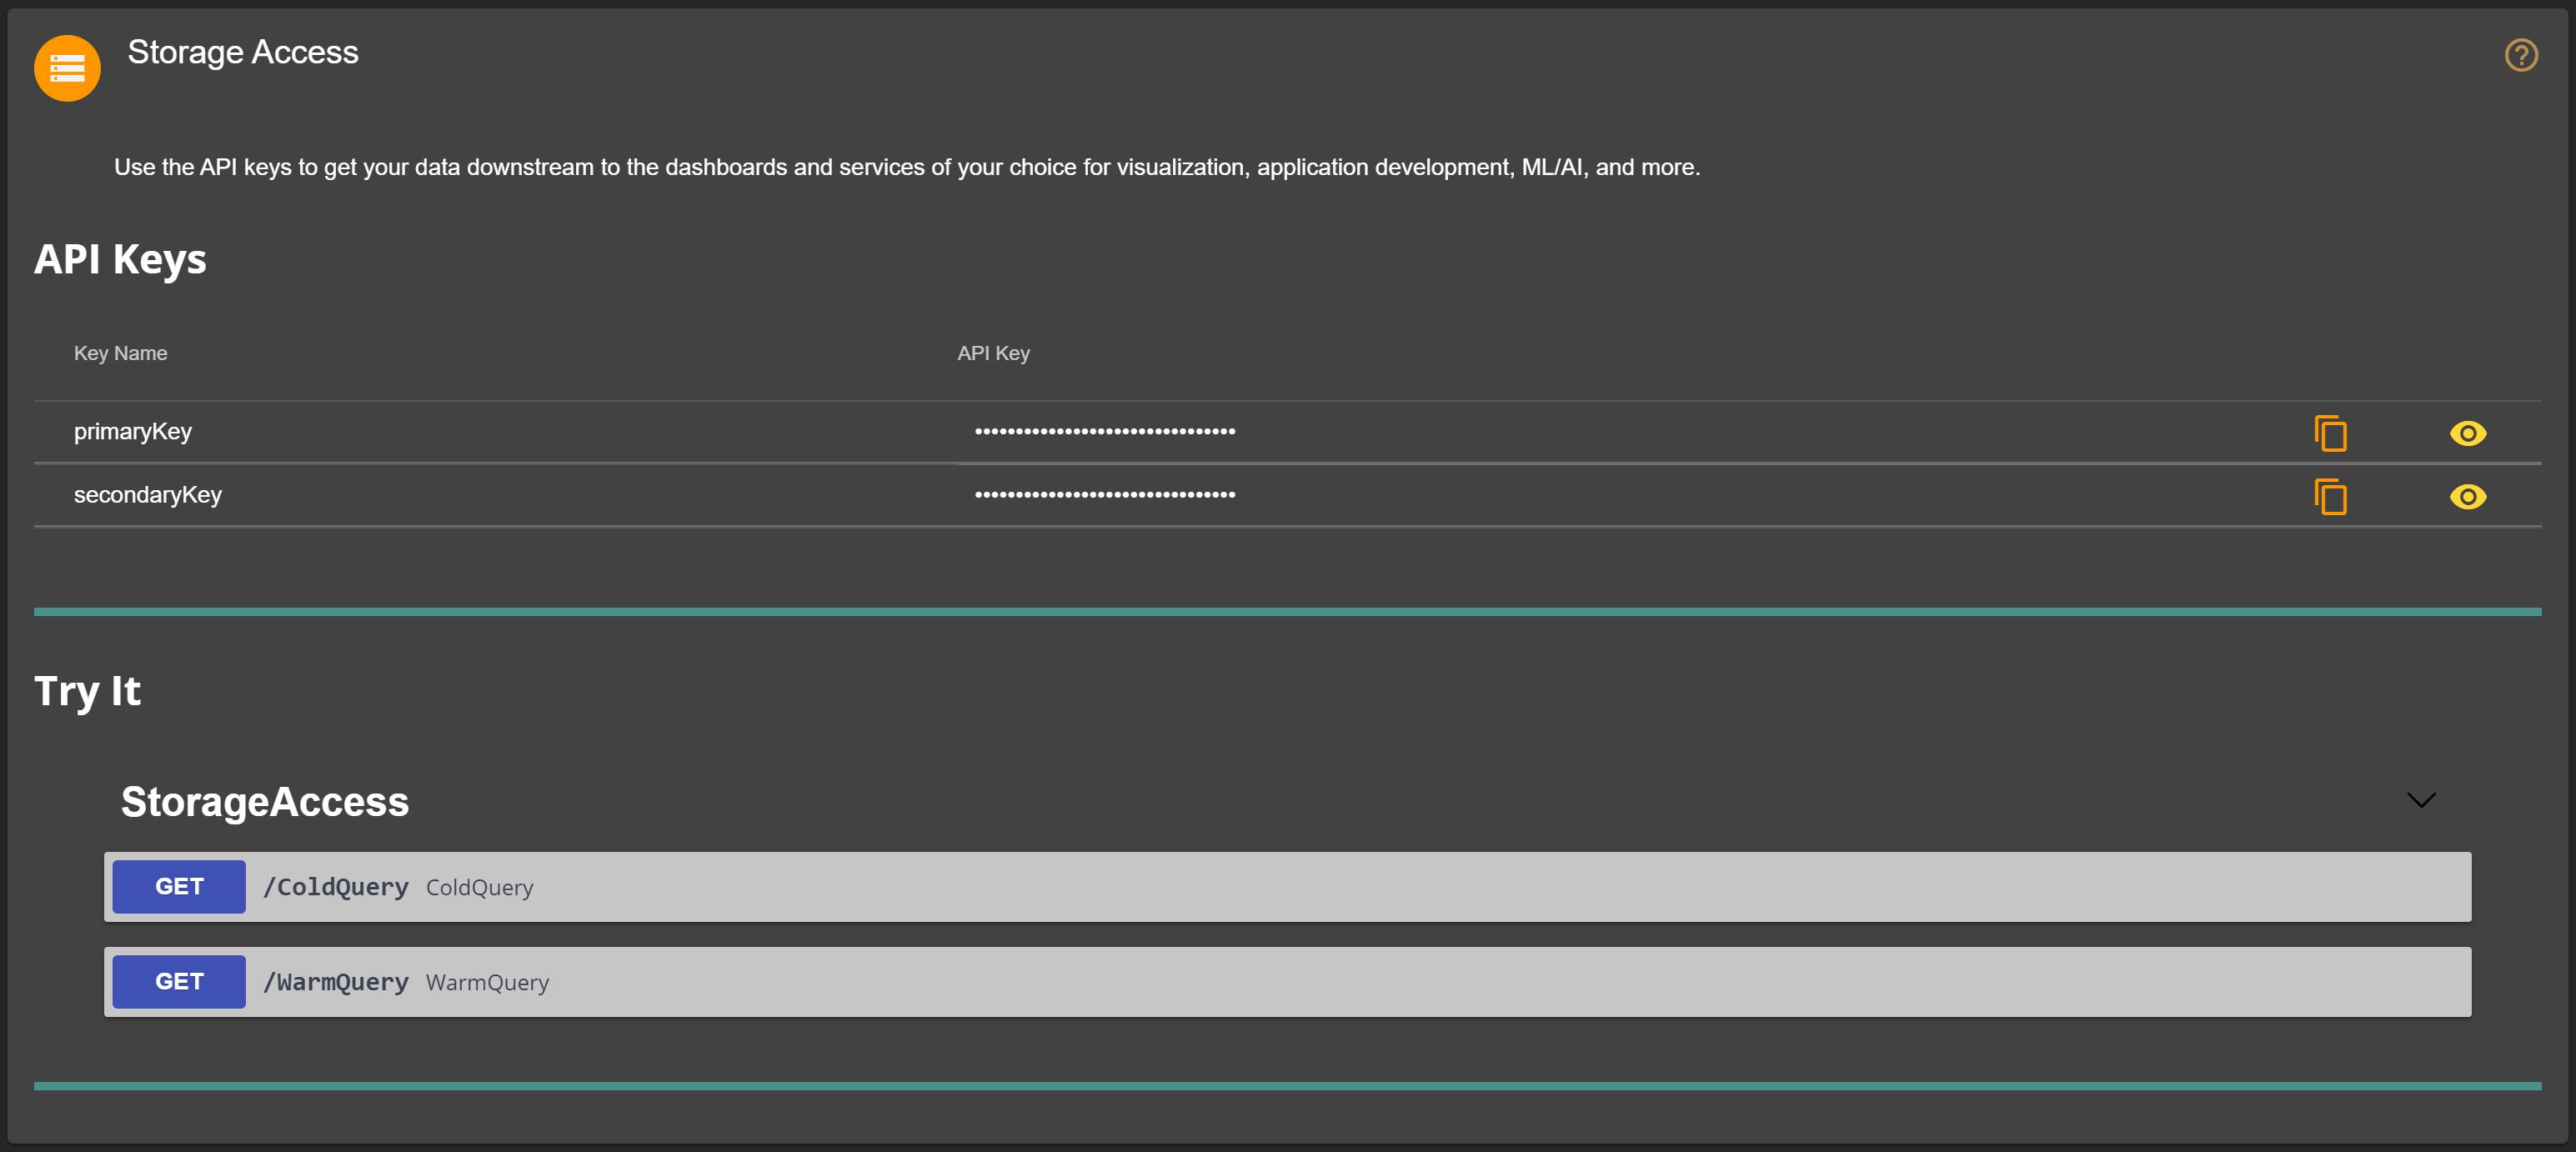
Your IoT Ensemble Dashboard will give you access to API Access Storage Keys as well as interactive forms to obtain request URLs for cold and warm storage queries. This is all you need to get started visualizing data with Power BI!
IoT Ensemble Storage Access
IoT Ensemble provides out of the box APIs that allow you to interact with your data and devices. Leveraging the cold query endpoint will allow us to easily connect with Power BI.
note
IoT Ensemble Storage Access can be leveraged to connect to many diffrent types of services, check the full documentation for more details.
Configuring Power BI Desktop
Make sure that you've downloaded and installed Power BI Desktop. Once installed, launch it and go to Get Data -> Web. As you may have guessed, this data source will allow you to import data from the web.
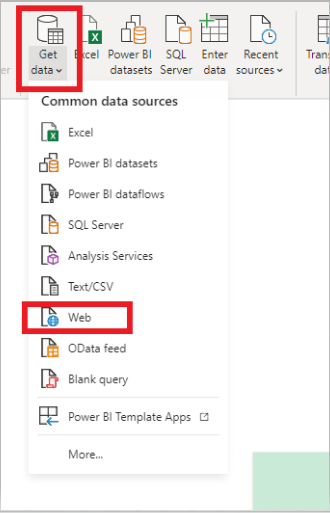
Once this has been selected, a popup will appear allowing input of the API URL. You will need to select the Advanced radio button to input the Access Key as an additional header parameter.
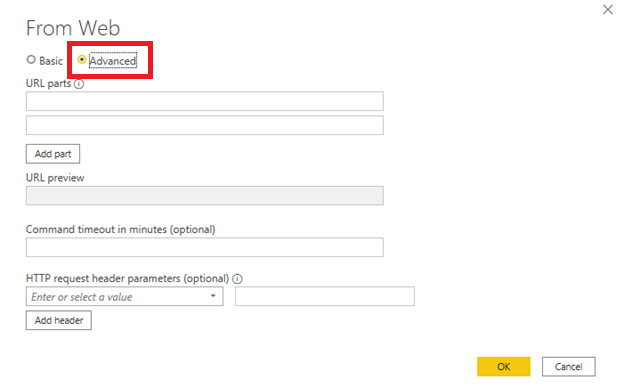
The API request URL can be obtained from the dashboard using either the cold or warm query APIs. Here is a sample cold query URL you can start with, and the dashboard will assist in discovering the parameters for this query.
https://fathym-cloud-prd.azure-api.net/fathym/ColdQuery?flatten=false&resultType=JSON
note
If you would like to use the emulated data, add an additional query string parameter of includeEmulated=true:
https://fathym-cloud-prd.azure-api.net/fathym/ColdQuery?flatten=false&resultType=JSON&includeEmulated=true
Now input the request URL from above (or obtained from the dashboard) into the Power BI URL Parts text field. Then enter lcu-subscription-key as a header parameter key, along with the Access Key copied from IoT Ensemble Dashboard in the value text field.
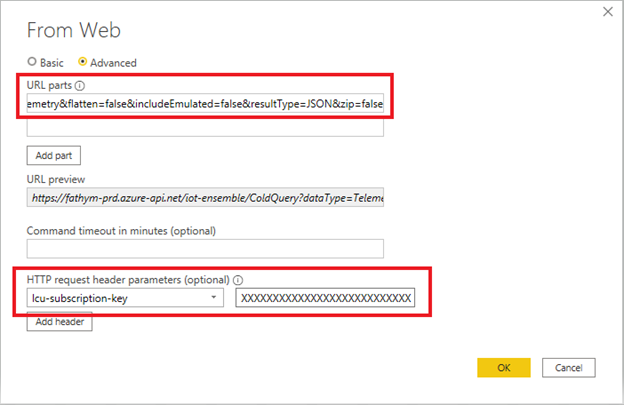
With these values entered, select OK and the Power Query Editor will load your JSON payloads. These will need to be converted to a table before you can visualize your data.
Preparing Data for Use
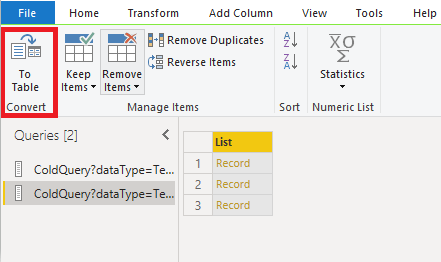
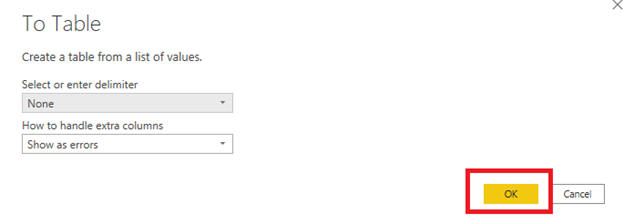
Now that the data is connected into our report, we need to convert it to a table. Do this by selecting To Table and then OK from the following popup.
The data is still showing as a single complex option. Select the expand arrows icon and Power BI will begin to break down the complex object into columns.
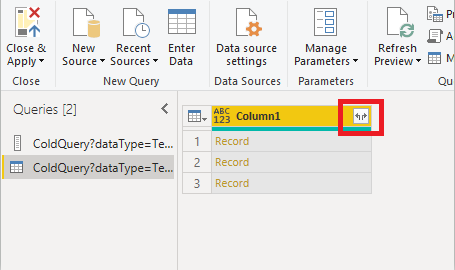
After converting to a table and expanding the record, you may notice that some columns still say Record. You will need to repeat this expanding process on those columns to expose the nested json data for use in Power BI.
Congratulations! The device data has now been loaded into Power BI. The final step before you can use the data in visualizations is to transform the data from a Text type to Number, Dates, and other types.
Transforming Data with Power BI
Transforming Data with power BI will allow you to customize data based on requirements. Power BI allows the user to remove duplicate values, create new columns, define table headers, convert data types, use calculated columns etc. Power BI has an incredible number of features that are dedicated to helping clean and prepare data for analysis. You may want to use Power Query Editor to clean up and shape this data before you start building reports.
Additional information on how to shape your data can be found all over the internet, here are a couple places to get started. You may want a learning path for cleaning, transforming and loading data, and to expand on that, look into shaping and combing data.
When your query is where you want it, select Close & Apply from Power Query Editor's File menu.
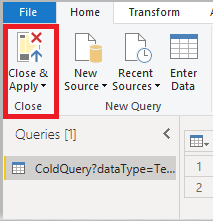
This action applies the changes and closes the editor. The transformed dataset appears in the Power BI Desktop, ready to be used for creating reports.
Visualize Data with Power BI
Now that you have transformed and loaded your data, it is time to prepare reports and visualizations for data interpretation and analysis. In the Fields pane on the right, you see the fields in the data model you just transformed and created.
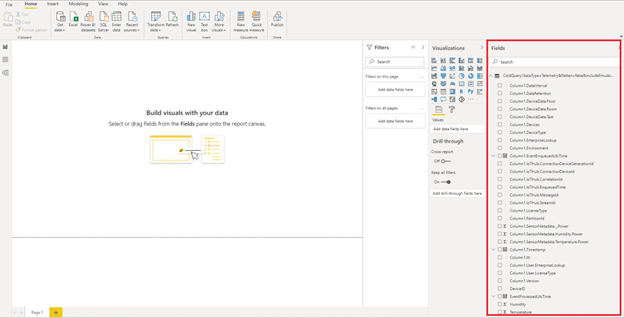
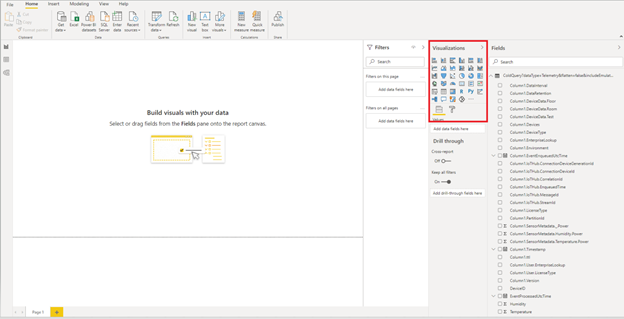
Power BI can help you create compelling reports where you can change visualizations, customize colors or axes, apply filters, drag fields, and more! All these changes are fun to do, easy to undo, and quick to take effect. The Visualizations pane provides the tools necessary for adding and configuring multiple visualizations. Power BI has a growing list of visualizations you can download and use in your own reports that transforms complicated data into something easy to understand. This ease provides insights to make informed decisions quickly.
Additional information on how to visualize and bring your data to life can be located across the internet. You can get started on building your report and work through a quick 10 minute example to get you going.

Wrapping Up
That's it! In this tutorial you have leveraged IoT cloud architecture, open-source programming and affordable hardware to create an end-to-end solution. Granted, in the grander scheme of things there is a whole lot more to IoT than this, but this is a great starting point for your IoT journey.
To continue your journey, leverage IoT Ensemble's shared plans to expand your number of devices and data velocity. When you’re ready, move onto an enterprise plan to take advantage of IoT Ensemble’s simplicity but with access to best practice cloud infrastructure in your own cloud environment.