Habistack | Knowing when and where a hurricane will hit
September 28, 2022 by Kim Loomis, Product Owner @ Fathym
In this piece:
- What weather creates a Hurricane
- How Habistack API and Proadject application provide weather data
- How to get the weather data for your location
Global Storms
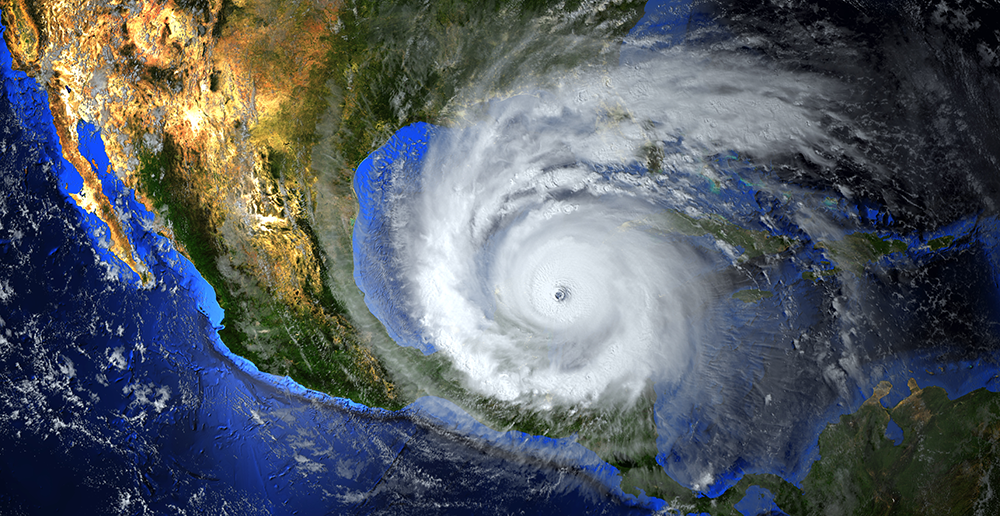
Big storms are happening across the globe. Hurricane Fiona has wrecked the island of Puerto Rico. Typhoon Merbok ravaged the western coastline of Alaska. Both caused widespread damage, flooding and power outages.
Now, Hurricane Ian is heading north through the Gulf of Mexico toward Florida. Some places, like St. Petersburg and Tampa Bay, on the western side of the state, could see a hurricane make landfall for the first time in nearly 100 years.
Be Informed and Ready
Preparing for a big storm means understanding what could happen; hoping for the least amount of damage but preparing for the worst. One of the most important things you can do is to arm yourself with information about the storm itself. That information starts with knowing when and where the storm will come toward you and how strong the storm will be at that moment. The information will tell you better about how you should prepare to ride out the storm safely at your location or if the storm is of such significance you need to evacuate to a safer area.
What Weather Makes a Hurricane
Various weather variables have a direct bearing on hurricanes. Air temperature, water temperature, wind and pressure are the main ones.
While hurricanes can happen in the Pacific Ocean basin, the storms that have the most impact to people, land and goods occur out of the Atlantic Ocean basin. These storms tend to get their start off the African continent and head west toward the Caribbean, Gulf of Mexico (like Ian is doing) and the North American eastern coastline.
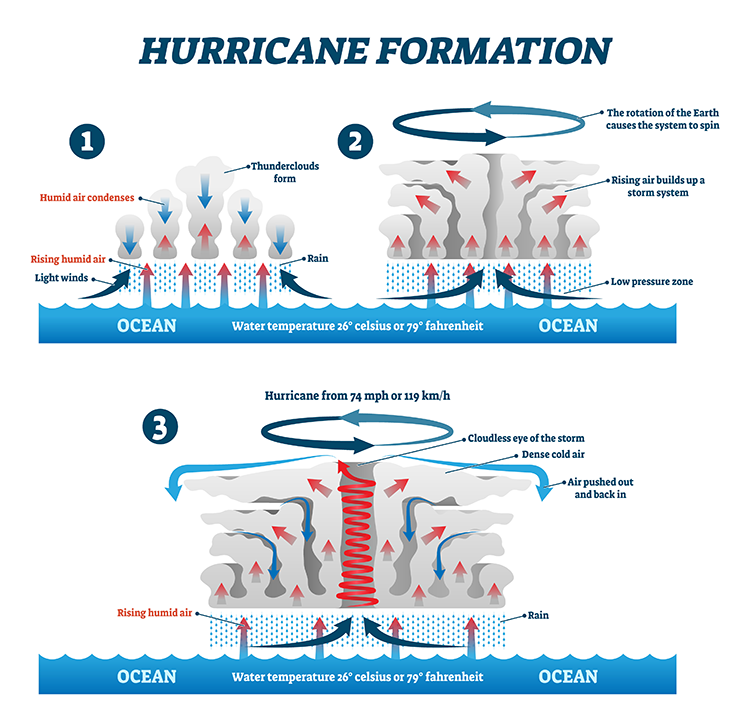
From Scientific American, "Hurricanes almost always form over ocean water warmer than about 80 degrees F. in a belt of generally east-to-west flow called the trade winds. They move westward with the trade winds and also drift slowly poleward.”
Hurricanes start over an ocean. The National Oceanic and Atmospheric Administration further explains, “A weather system moves westward [from Africa] across the tropics, warm ocean air rises into the storm, forming an area of low pressure underneath. This causes more air to rush in. The air then rises and cools, forming clouds and thunderstorms. Up in the clouds, water condenses and forms droplets, releasing even more heat to power the storm. When wind speeds within such a storm reach 74 mph, it’s classified as a hurricane.”
With climate change and the world getting warmer each year, the oceans are absorbing more heat. Hurricanes are affected by both high air temperature and water temperature. They need heat to produce rain. The warmer the air, the more moisture the air can hold and the more rain that is likely to be produced.
Low atmospheric pressure (air pressure) fuels the ferocity of hurricanes. The lower it goes, the worse the storm in intensity, strength and wind speed. Atmospheric pressure is the force exerted on a surface by the air above it as gravity pulls it to Earth or more simply, the weight of air.
Think of the saying “warm air rises.” A couple things are at work here. Given the way in which the sun hits the earth, the regions near the equator are hotter. The air near the equator heats, rises and spreads toward the poles and colder air settles over the equator, only to start the process over.
And then there is wind to consider. Air moves in different directions in the hemispheres and creates the wind spirals that we know as high pressure and low pressure systems. High pressure generally means calm weather while low pressure suggests unsettled weather and the potential to spawn a hurricane.
Get the Data You Need
There are millions of people in the path of Hurricane Ian in Florida. It can be tough to know when to ride out the storm at your home with your life’s belongings and when to take your loved ones to safer grounds and leave behind your material goods. It’s tougher when the resources you depend on for information are uncertain as to where the hurricane will go. For example, according to this NPR article, Ian’s path has changed over the course of just the last few days. Being able to get your hands on data that is pertinent to you, right down to your exact latitude and longitude, is crucial.
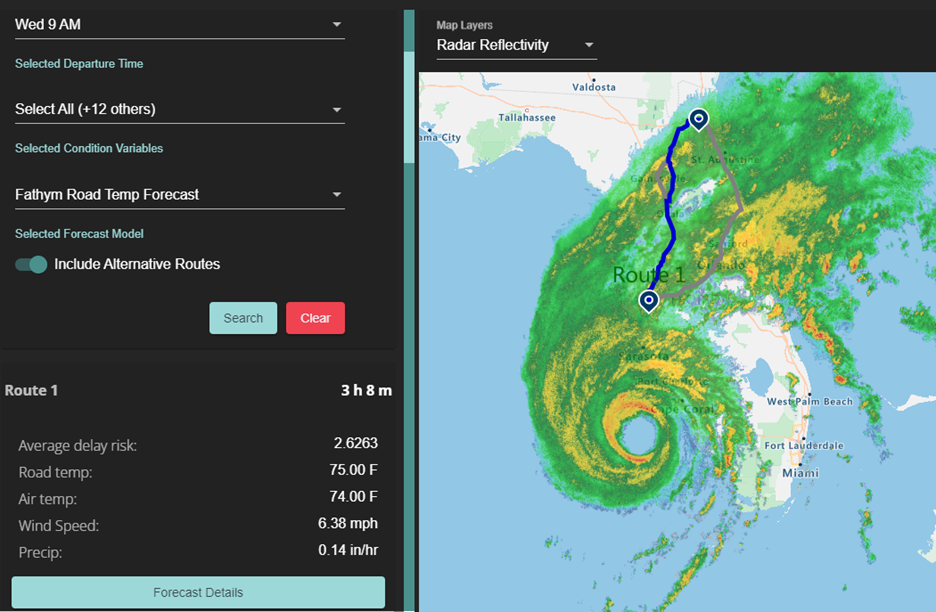
The data you need is easily accessible. Using Fathym’s free application Proadject which receives its data from the Fathym Habistack API, here are three images of the radar reflectivity (basically the energy of the weather reflected to radar) over Florida.
The first image is on Tuesday, 27 September 2022, forecasted for a departure at 7pm. This is also showing an evacuation route out of Tampa going north to Jacksonville.
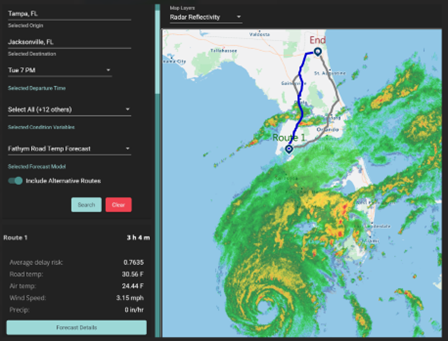
The second image is the same area same day but for a forecasted departure of 11pm, 4 hours later. You can see how the storm is shifting.
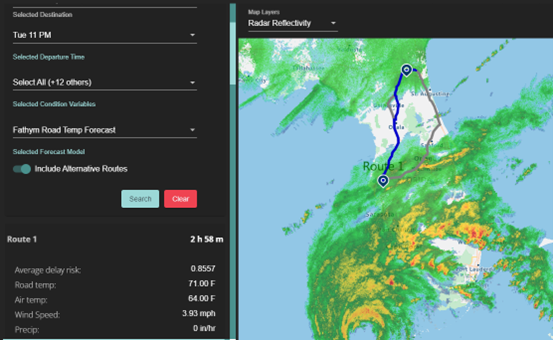
The third image is for the same area but for a forecasted departure of 9am 28 September 2022, next day. You can see again how the storm has moved. The evacuation route will incur some of the brunt of Ian.
Providing Weather Data to Track Hurricanes
Habistack is a robust, feature-rich API that offers a powerful suite of weather forecasting and open-source data visualization tools. The Habistack API allows the forecasters to keep constant outlook on what is happening across the U.S., wherever their tracks are located.
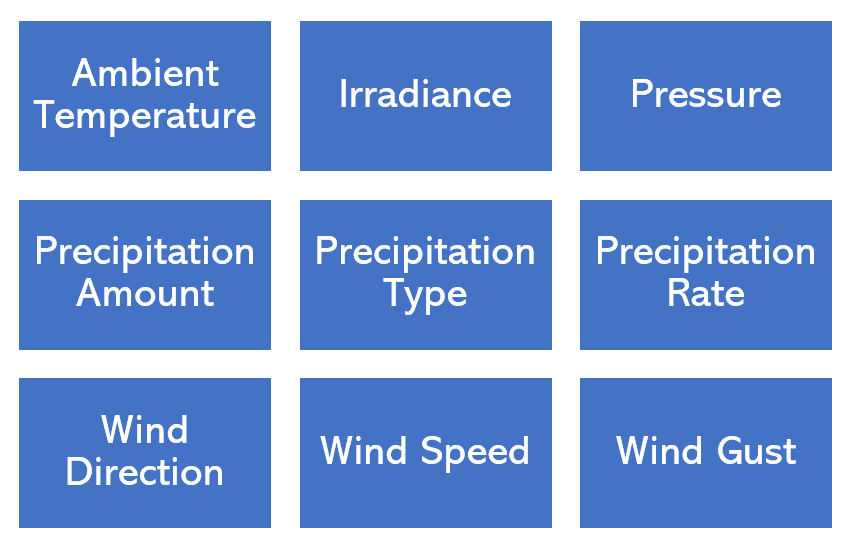
Fathym Habistack Weather API
Habistack combines the world's best weather forecasts with statistics-based, machine-learning techniques to tackle the largest datasets, including road weather. Habistack offers developers comprehensive weather forecasting capabilities over freely chosen locations and routes across the globe, with any combination of variables. The API delivers a unique suite of highly specialized forecast variables derived through statistically based machine learning models.
Example Data Call
Get started right now with Proadject and adjust your destination, departure time, and conditions to meet your needs. Or use Habistack's forecaster API capabilities to incorporate this data into your web apps .
Here’s the data call to paste into the Habistack dashboard to know what is going to happen in Tampa, FL over the next 16 hours.
This data call requests 6 variables (WindGust, WindDirection, WindSpeed, PrecipitationRateMillisHr, TotalPrecipitation and Temperature” over a period of 16 hours, where each hour is valued as relative seconds (3600 seconds = 1 hour, 7200 seconds = 2 hours, etc.).
This call would be pasted into the “POST” call Request Body on the Habistack site – note you would need to sign up for Habistack and receive an API key for this work.
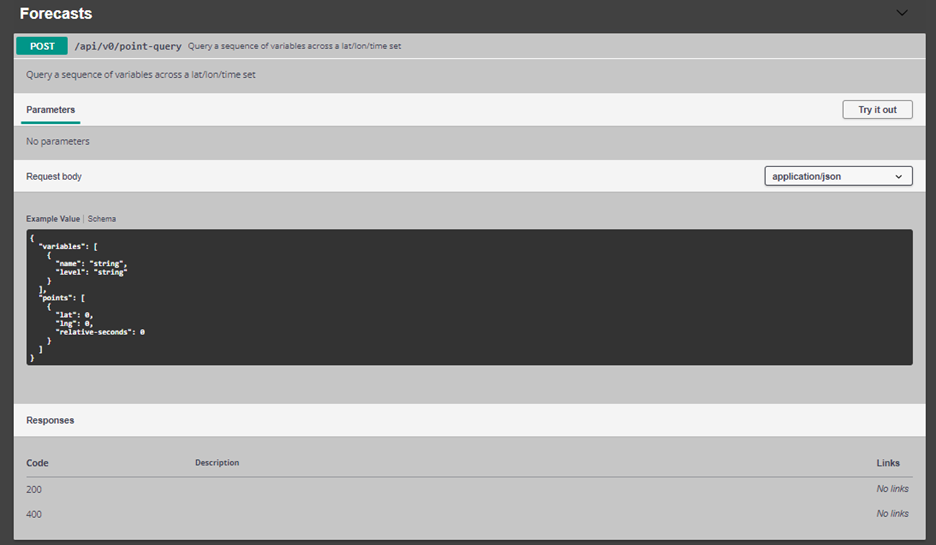
Request Body
{

  "variables": [

    {

      "name": "WindGust",

      "level": "Surface"

    },

  {

    "name": "WindDirection",

    "level": "10Meters"

  },

  {

    "name": "WindSpeed",

    "level": "10Meters"

  },

  {

    "name": "PrecipitationRateMillisHr",

    "level": "Surface"

  },

  {

    "name": "TotalPrecipitation",

    "level": "Surface"

  },

  {

    "name": "Temperature",

    "level": "Surface"

  }

  ],

  "points": [

    {

      "lat": 27.7634,

      "lng": -82.5437,

      "relative-seconds": 3600

    },

    {

      "lat": 27.7634,

      "lng": -82.5437,

      "relative-seconds": 7200

    },

    {

      "lat": 27.7634,

      "lng": -82.5437,

      "relative-seconds": 10800

    },

    {

      "lat": 27.7634,

      "lng": -82.5437,

      "relative-seconds": 14400

    },

    {

      "lat": 27.7634,

      "lng": -82.5437,

      "relative-seconds": 18000

    },

    {

      "lat": 27.7634,

      "lng": -82.5437,

      "relative-seconds": 21600

    },

    {

      "lat": 27.7634,

      "lng": -82.5437,

      "relative-seconds": 25200

    },

    {

      "lat": 27.7634,

      "lng": -82.5437,

      "relative-seconds": 28800

    },

    {

      "lat": 27.7634,

      "lng": -82.5437,

      "relative-seconds": 32400

    },

    {

      "lat": 27.7634,

      "lng": -82.5437,

      "relative-seconds": 36000

    },

    {

      "lat": 27.7634,

      "lng": -82.5437,

      "relative-seconds": 39600

    },

    {

      "lat": 27.7634,

      "lng": -82.5437,

      "relative-seconds": 43200

    },

    {

      "lat": 27.7634,

      "lng": -82.5437,

      "relative-seconds": 46800

    },

    {

      "lat": 27.7634,

      "lng": -82.5437,

      "relative-seconds": 50400

    },

    {

      "lat": 27.7634,

      "lng": -82.5437,

      "relative-seconds": 54000

    },

    {

      "lat": 27.7634,

      "lng": -82.5437,

      "relative-seconds": 57600

    }

  ]

}
Example Data Returned
The call will return data like below under the Responses section.
The numbers shown under each variable (like WindGust) represent the value at that point in time (the relative-seconds listed in the call above). So the “15.511755” value for WindGust is for 3600 seconds or the next 1 hour. The “17.0205” is for the time period of 7200 seconds or two hours into the forecast. And so on.
The measurement of WindGust can be found in the Habistack documentation and is meters/second. So, the “15.511755 m/s” translates to 34.69880771 mph. As the numbers are rising over time, the wind gust speed is increasing to the max of “28.153395 m/s” which translates to 62.97735102 mph.
That’s some significant wind happening!
Response Body
  {

    "name": "WindGust",

    "level": "Surface",

    "values": [

      15.511755,

      17.0205,

      17.441402,

      16.157043,

      17.446234,

      17.93468,

      20.196587,

      21.87679,

      22.443142,

      24.952808,

      25.301262,

      24.821604,

      26.81464,

      28.153395,

      28.130692,

      27.942125

    ]

  },

  {

    "name": "WindDirection",

    "level": "10Meters",

    "values": [

      58.839317,

      54.942894,

      51.174896,

      48.422283,

      56.5666,

      59.637527,

      55.794586,

      51.51915,

      47.452065,

      42.620186,

      42.482513,

      41.49489,

      41.94184,

      39.09597,

      49.073296,

      46.117928

    ]

  },

  {

    "name": "WindSpeed",

    "level": "10Meters",

    "values": [

      12.422591,

      13.413424,

      13.703384,

      13.485511,

      13.578521,

      14.155109,

      15.832058,

      16.405111,

      16.975517,

      18.511929,

      19.206894,

      18.00587,

      21.008175,

      21.971266,

      20.96748,

      21.02273

    ]

  },

  {

    "name": "PrecipitationRateMillisHr",

    "level": "Surface",

    "values": [

      0,

      0.7815000484697521,

      1.6010000836104155,

      1.2790000531822443,

      2.121999906376004,

      4.60400003939867,

      5.400000046938658,

      4.097500070929527,

      20.793000608682632,

      17.721499130129814,

      10.132500529289246,

      5.253499886021018,

      12.221559137105942,

      14.011868275702,

      13.113308139145374,

      17.543556354939938

    ]

  },

  {

    "name": "TotalPrecipitation",

    "level": "Surface",

    "values": [

      0.8817083,

      1.4399444,

      2.5834584,

      4.6477222,

      6.580792,

      9.211888,

      14.480208,

      21.151207,

      28.209347,

      38.320625,

      51.603973,

      63.18922,

      17.753733,

      28.413542,

      43.47005,

      22.051128

    ]

  },

  {

    "name": "Temperature",

    "level": "Surface",

    "values": [

      302.87546,

      302.87616,

      302.86548,

      302.88248,

      302.87698,

      302.89523,

      302.91382,

      302.8802,

      302.86807,

      302.8728,

      302.86276,

      302.8925,

      302.59244,

      302.60828,

      302.58035,

      302.532

    ]

  }

]