AutomationDirect Grafana Dashboards
July 13, 2021 by Matt Jackson, Product Support Specialist @ Fathym
Once you have your AutomationDirect BRX PLC data flowing to the cloud, it's time to create some Grafana Dashboards so that you can easily monitor everything. But first things first, let's get our AutomationDirect BRX PLC connected to Microsoft Azure.

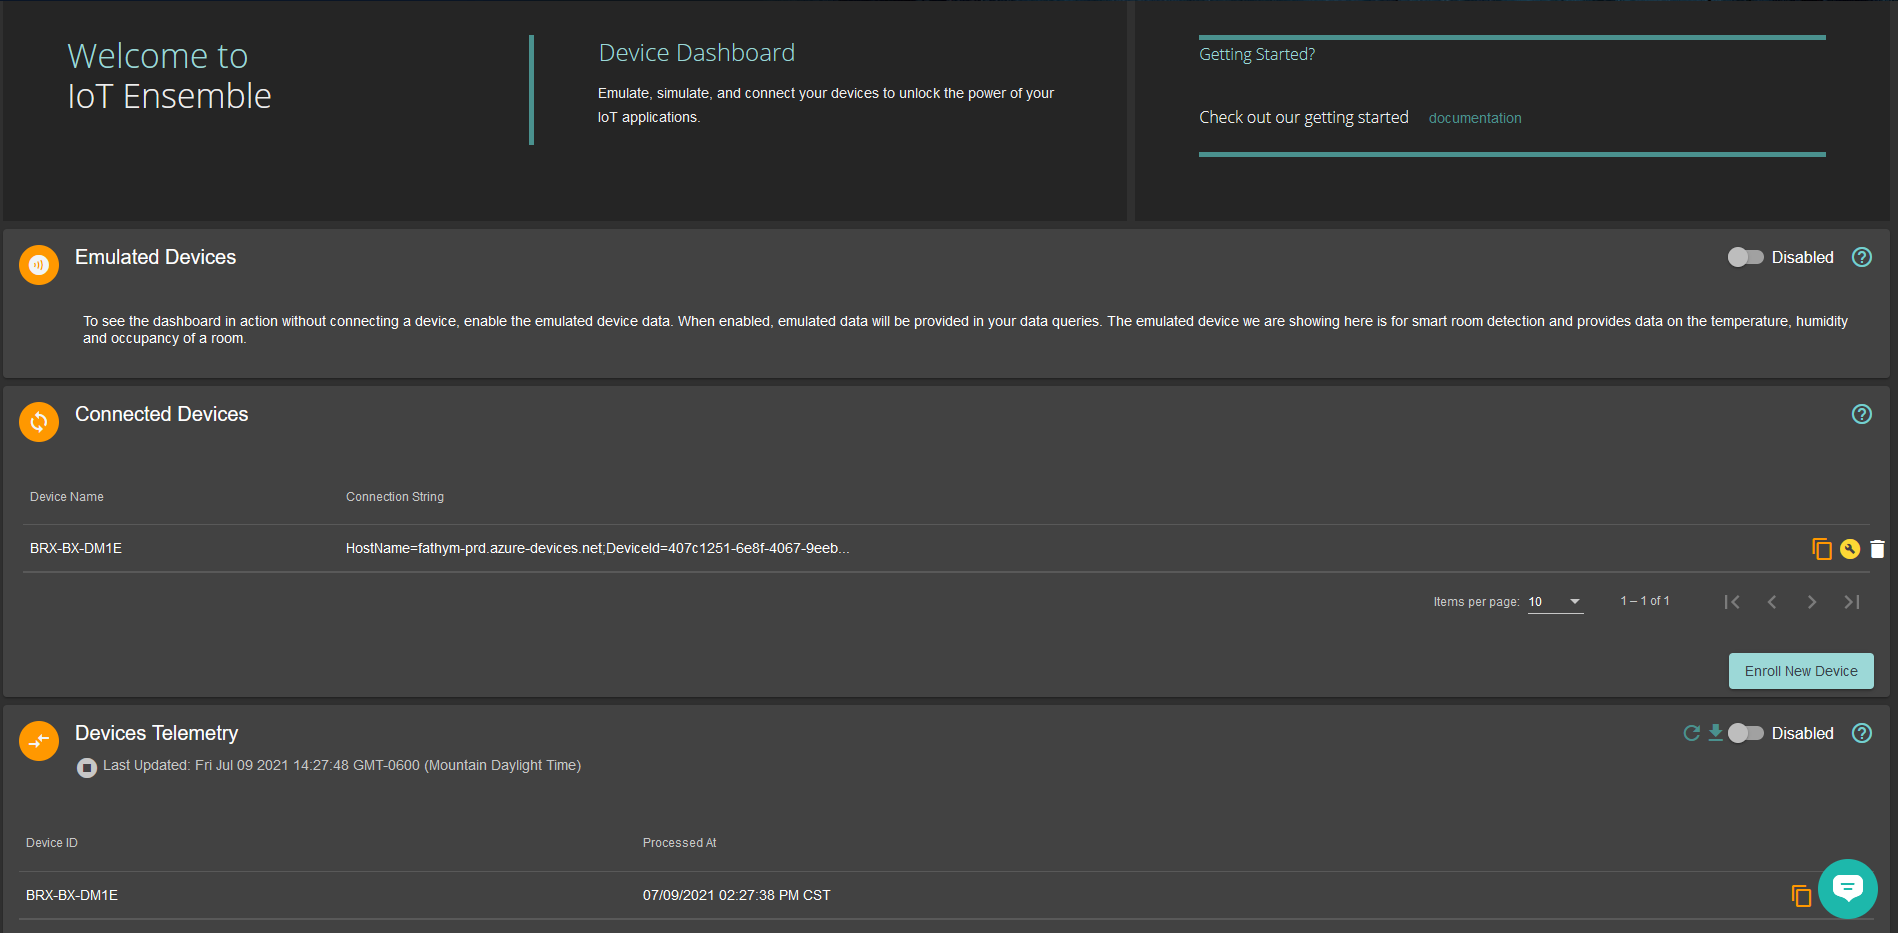
AutomationDirect BRX PLC has a great guide located here that shows how to connect your AutomationDirect BRX PLC device to an Azure IoT Hub. It's a great source and very informative. However, instead of going through all of the tedious steps outlined in the tutorial of setting up an Azure resource group, the IoT Hub, storage containers, the storage endpoints, and everything else, I prefer to use Fathym's IoT Ensemble. With one click I can register my AutomationDirect BRX PLC device and immediately get access to the data for downstream use in alerts, dashboards, visualizations, and machine learning. After I enroll my device in IoT Ensemble, it displays the IoT Hub connectionstring. I take the connectionstring into the config to use as my Azure Key and I'm ready to rock. Here's a screenshot of my connected AutomationDirect BRX PLC.

The AutomationDirect data is immediately flowing to IoT Ensemble and I can view the data on screen. Reminder that behind the scenes in IoT Ensemble the AutomationDirect data is stored in Microsoft Azure in blob storage, as well as in CosmosDB.
How to access data in Microsoft Azure
Behind the scenes in IoT Ensemble the AutomationDirect data is stored in Microsoft Azure in blob storage, as well as in CosmosDB. Read this to learn more about accessing your data
Fathym's IoT Ensemble is providing an easy-to-use UI for interacting with the data instead of using the Azure portal - and it saves me a ton of time and money.

AutomationDirect Grafana Dashboards
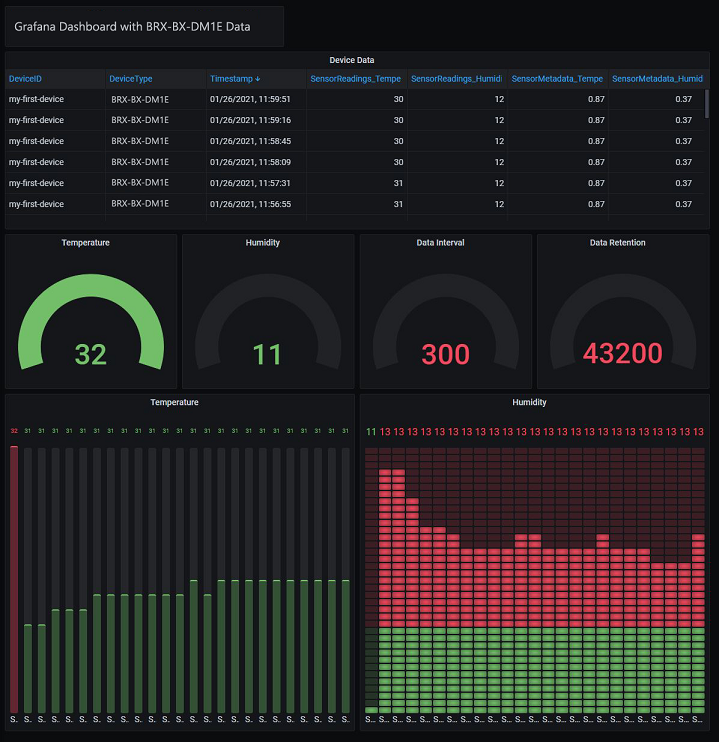
Now that my AutomationDirect data is flowing to IoT Ensemble, it's time to create some Grafana Dashboards to monitor everything. This IoT Ensemble doc explains how to import data from IoT Ensemble into Grafana and setup a dashboard. Here's a screenshot.

Sign up for IoT Ensemble and save your company thousands of dollars in Azure setup and management costs. Enroll your first AutomationDirect BRX PLC with IoT Ensemble for free. No credit card required. No Azure account required. It really is that simple.
info
Enroll your first AutomationDirect BRX PLC with IoT Ensemble for free.
No credit card required.
No Azure account required.