Viewing Device Data
Viewing device messages is the first step in understanding and debugging IoT data flows. In this portion of the guide, we'll go through what the dashboard offers out-of-the-box.
Dashboard Views
The IoT Ensemble dashboard provides two quick ways to start looking at data. Using these, easily view raw device message payloads and visualize data in an open source dashboard.
Devices Telemetry
We used the devices telemetry table when working through the emulated data and connecting a device guides. Here is a deeper look at how it works.
Telemetry Sync
Each of the dashboard views is powered by the telemetry sync. The sync is responsible for preloading a set of telemetry based on the settings in this section. It will only run for 30 minutes at a time and must be restarted after that (the last loaded data will stay in sync once disabled). At the top of the Devices Telemetry section are the settings for the majority of the telemetry sync.

The toggle in this header enables and disables the telemetry sync, and the device telemetry can be downloaded using the ![]() button. Every time telemetry is enabled, a fresh 30 minute sync window is started. In addition, the top left status indicator will show if the sync is active and when it was last run.
button. Every time telemetry is enabled, a fresh 30 minute sync window is started. In addition, the top left status indicator will show if the sync is active and when it was last run.
Telemetry Table
When first connecting devices, this is a great place to start seeing data. A new row will show up for each message sent for any devices, when the sync is enabled, and will include emulated telemetry if turned on.

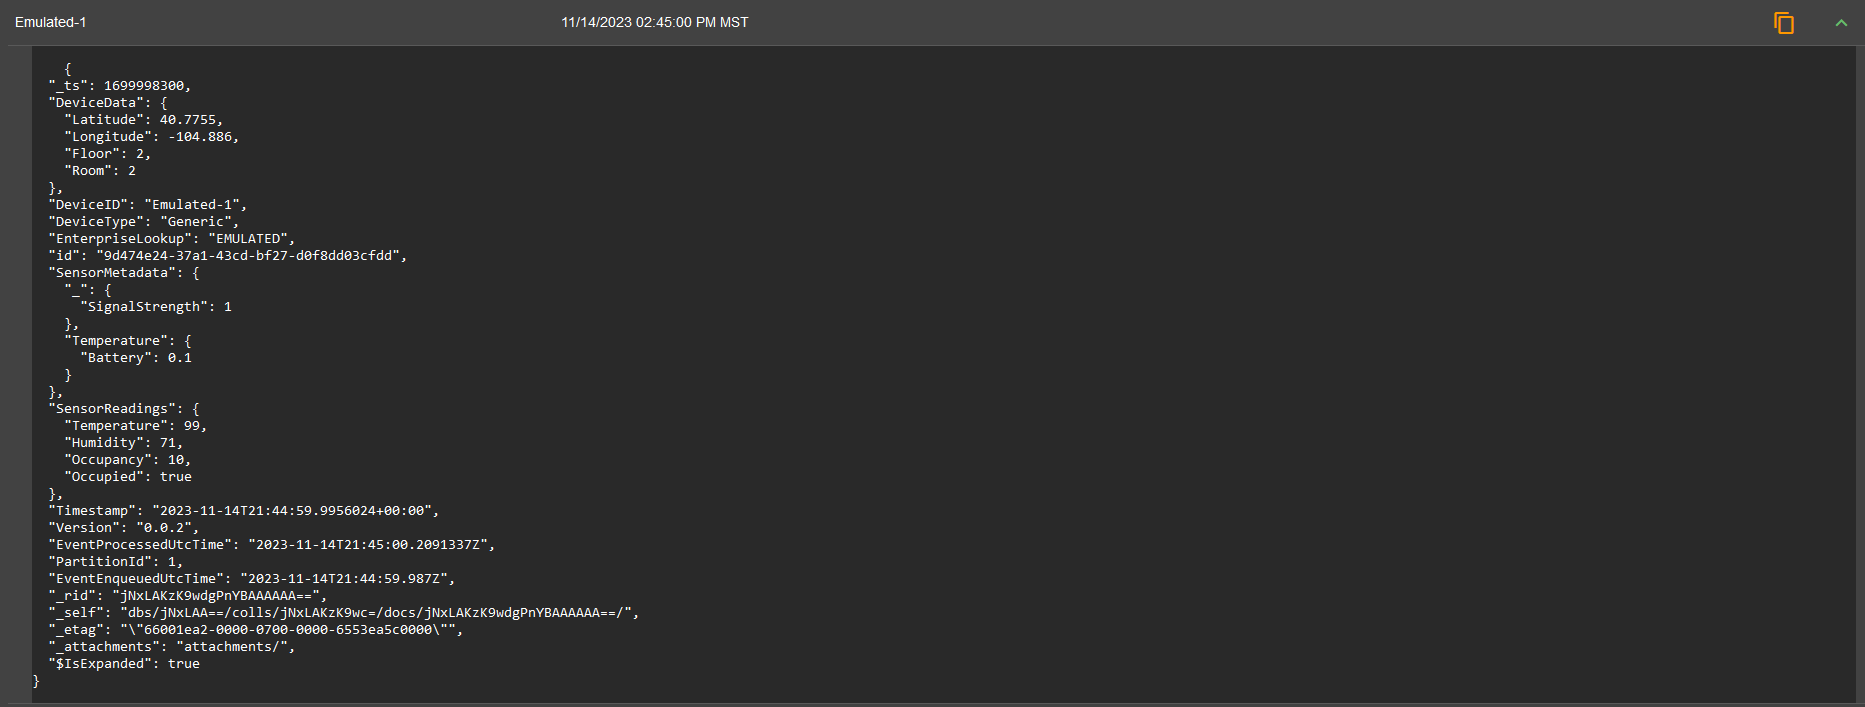
The system is dynamic in terms of how the payload can come in, so the telemetry row provides only the Device ID and the time at which the message was processed. To see what real data is flowing through, the copy or expand payload features can be used. Using the ![]() button will expand the row to show the raw payload of the message. To quickly copy the payload of one of the messages, use the
button will expand the row to show the raw payload of the message. To quickly copy the payload of one of the messages, use the ![]() button.
button.

Using the paging controls at the bottom will determine how many telemetry records are in each response and support paging through the results.
If you're seeing emulated data in the table and only want to see custom device data, make sure to disable the emulated data.
In the screenshot above, the following properties are not part of the IoT Best Practice Schema. Fathym IoT Ensemble is not adding these properties. These are system properties that are added by the IoT Hub.
"_ts": 1613087733"EventProcessedUtcTime": "2021-02-11T23:55:30.227905Z""PartitionId": 29"EventEnqueuedUtcTime": "2021-02-11T23:55:29.995Z""_rid": "8qpRAK49o3m60BAAAAAAAA==""_self": "dbs/8qpRAA==/colls/8qpRAK49o3k=/docs/8qpRAK49o3m60BAAAAAAAA==/""_etag": "\"09009632-0000-0700-0000-6025c3f50000\"""_attachments": "attachments/"
Telemetry Actions
As outlined previously in our connecting a device guide, use the send device message form to easily send sample data for a device into the system.
Freeboard Dashboard
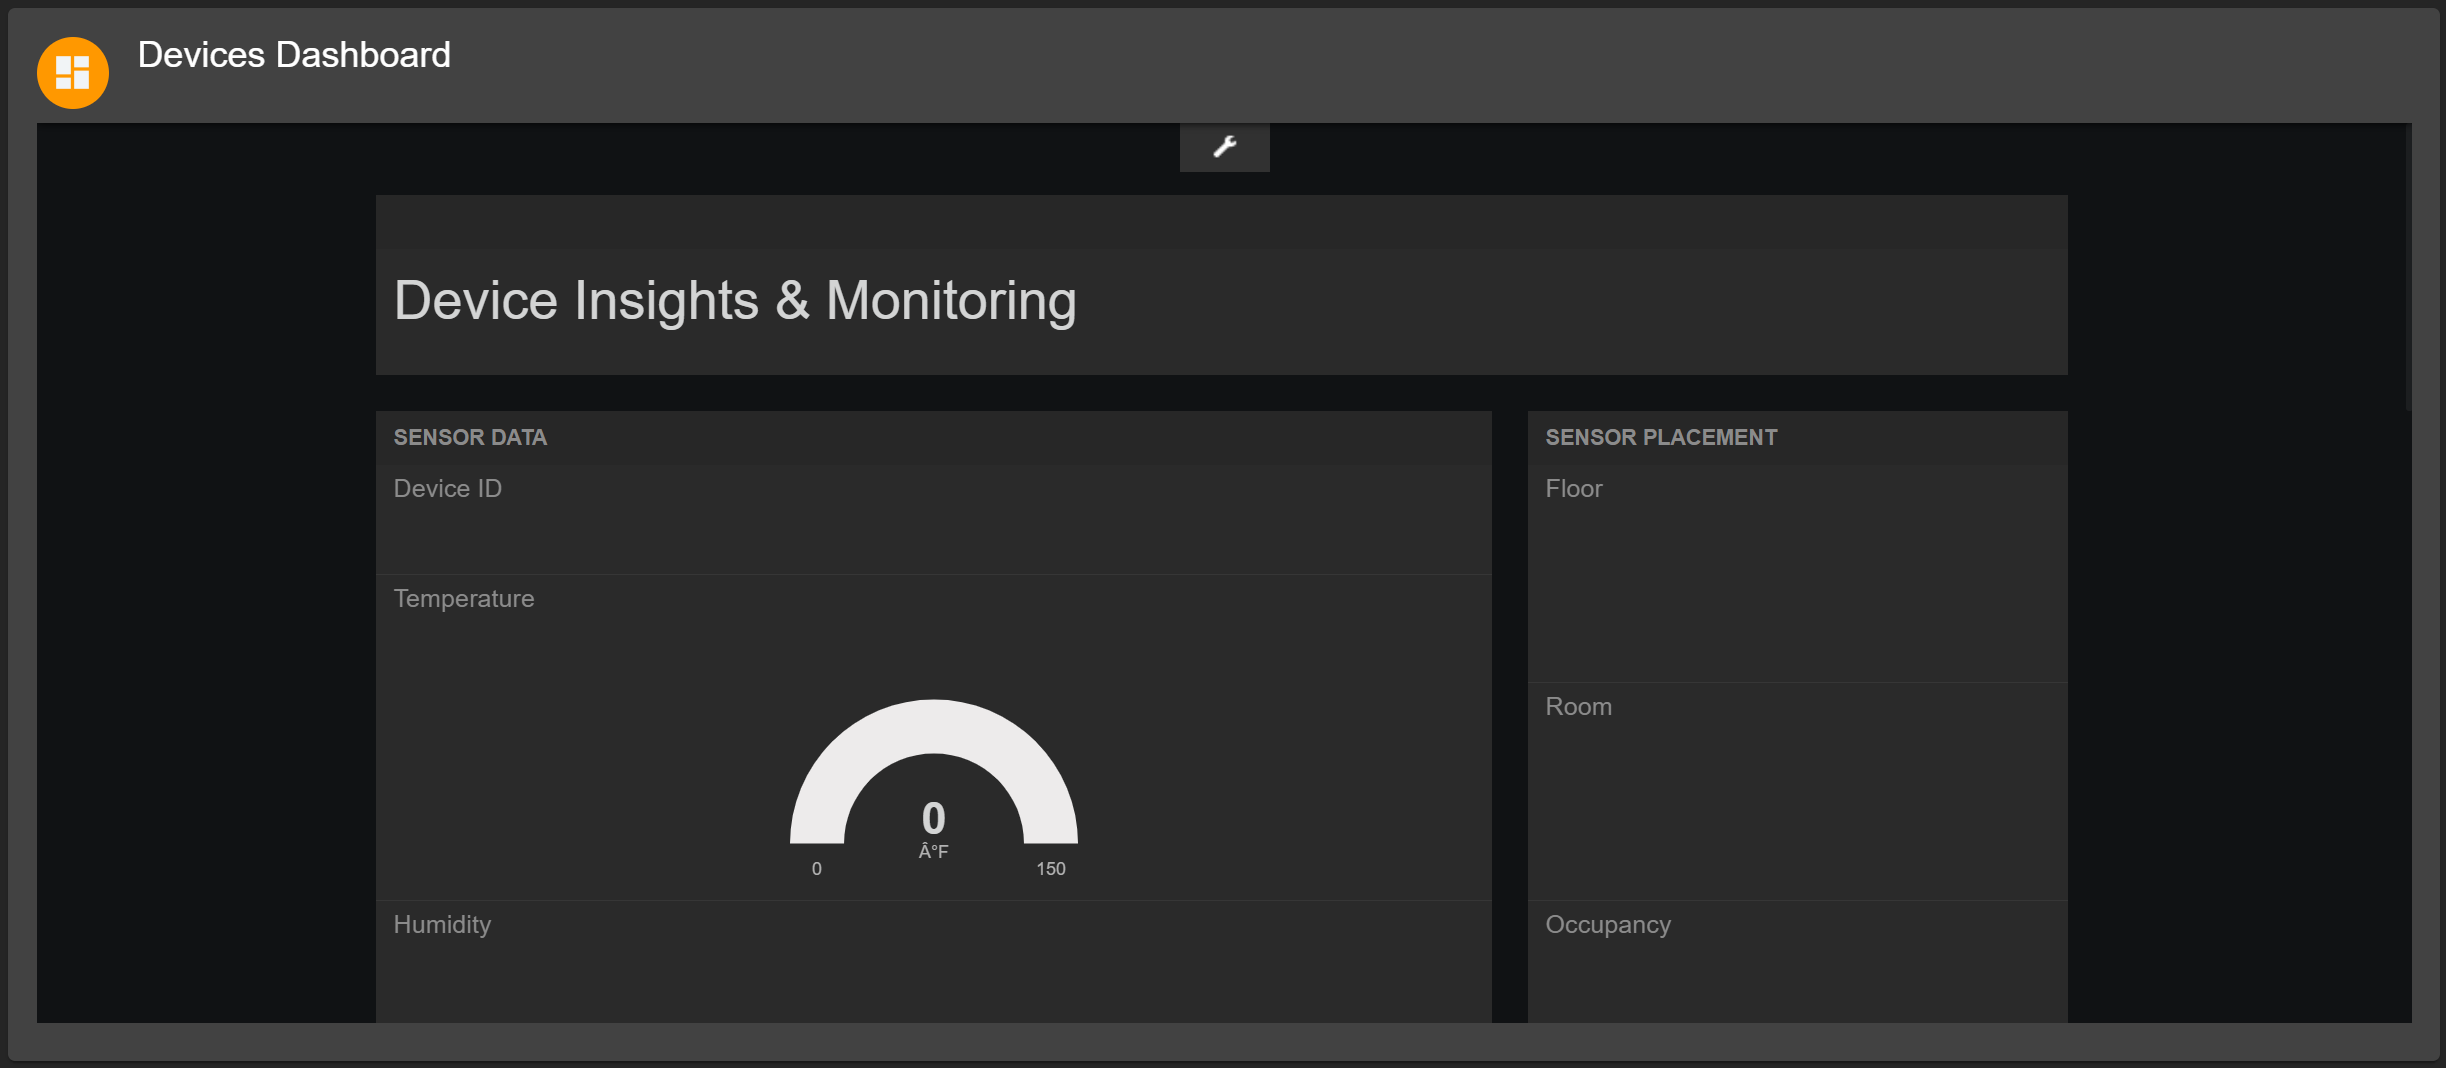
As an inline example of how data can be visualized, we use an open source tool called freeboard. Use this tool to create and locally save custom visualizations and later load them into view.

To edit the freeboard, click the  icon at the top of the freeboard. This will change the freeboard into edit mode. Now add new panes, edit existing ones and when complete click
  . Choose a path on the local computer to save the freeboard, and next time visiting the dashboard, simply use the
  option to load the custom freeboard configuration.
For more information on freeboard, how it works, and how to code it, please visit their documentation.