Storage Access with Microsoft Power BI
There are a lot of options in Power BI Desktop for importing data to be used in reports and visualizations for data interpretation. IoT Ensemble provides connection URLs and Storage Access Keys so you can import data from your devices into Power BI using the Web data source.
Your IoT Ensemble Dashboard will give you access to API Access Storage Keys as well as interactive forms to obtain request URLs for cold and warm storage queries. This is all you need to get started visualizing data with Power BI!
IoT Ensemble Storage Access
IoT Ensemble provides out of the box APIs that allow you to interact with your data and devices. Leveraging the cold query endpoint will allow us to easily connect with Power BI. Check out the getting started guide for more details.
Configuring Power BI Desktop
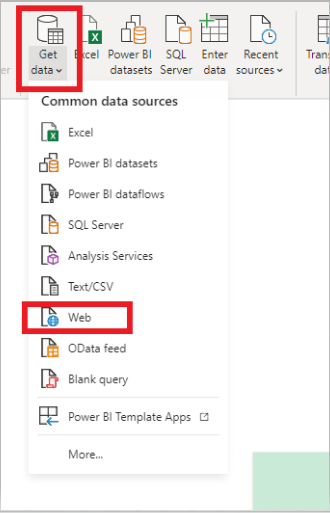
Make sure that you've downloaded and installed Power BI Desktop. Once installed, launch it and go to Get Data -> Web. As you may have guessed, this data source will allow you to import data from the web.
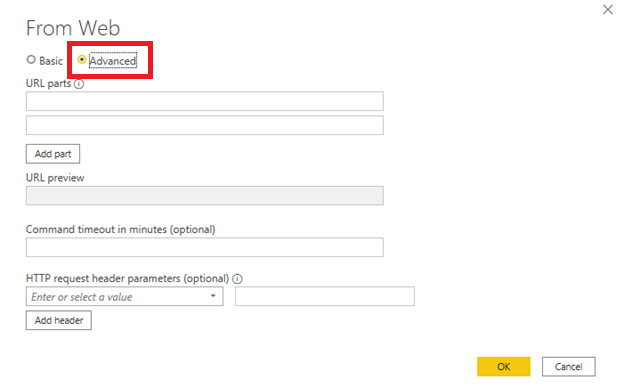
Once this has been selected, a popup will appear allowing input of the API URL. You will need to select the Advanced radio button to input the Access Key as an additional header parameter.
The API request URL can be obtained from the dashboard using either the cold or warm query APIs. Here is a sample cold query URL you can start with, and the dashboard will assist in discovering the parameters for this query.
https://fathym-cloud-prd.azure-api.net/iot-ensemble/ColdQuery?flatten=false&resultType=JSON
If you would like to use the emulated data, add an additional query string parameter of includeEmulated=true:
https://fathym-cloud-prd.azure-api.net/iot-ensemble/ColdQuery?flatten=false&resultType=JSON&includeEmulated=true
Now input the request URL from above (or obtained from the dashboard) into the Power BI URL Parts text field. Then enter lcu-subscription-key as a header parameter key, along with the Access Key copied from IoT Ensemble Dashboard in the value text field.
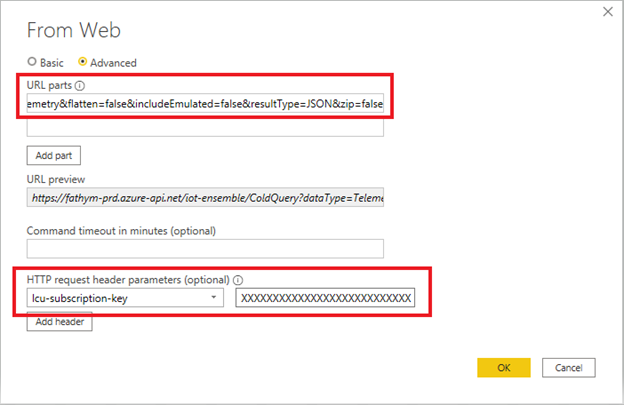
With these values entered, select OK and the Power Query Editor will load your JSON payloads. These will need to be converted to a table before you can visualize your data.
Preparing Data for Use
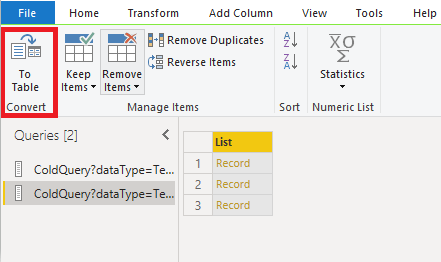
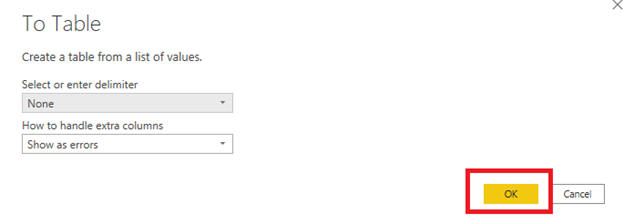
Now that the data is connected into our report, we need to convert it to a table. Do this by selecting To Table and then OK from the following popup.
The data is still showing as a single complex option. Select the expand arrows icon and Power BI will begin to break down the complex object into columns.
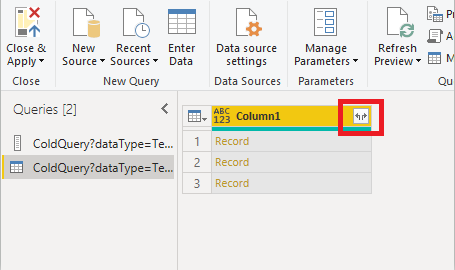
After converting to a table and expanding the record, you may notice that some columns still say Record. You will need to repeat this expanding process on those columns to expose the nested json data for use in Power BI.
Congratulations! The device data has now been loaded into Power BI. The final step before you can use the data in visualizations is to transform the data from a Text type to Number, Dates, and other types.
Transforming Data with Power BI
Transforming Data with power BI will allow you to customize data based on requirements. Power BI allows the user to remove duplicate values, create new columns, define table headers, convert data types, use calculated columns etc. Power BI has an incredible number of features that are dedicated to helping clean and prepare data for analysis. You may want to use Power Query Editor to clean up and shape this data before you start building reports.
Additional information on how to shape your data can be found all over the internet, here are a couple places to get started. You may want a learning path for cleaning, transforming and loading data, and to expand on that, look into shaping and combing data.
When your query is where you want it, select Close & Apply from Power Query Editor's File menu.
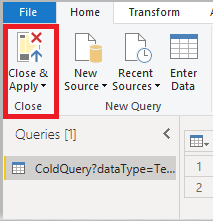
This action applies the changes and closes the editor. The transformed dataset appears in the Power BI Desktop, ready to be used for creating reports.
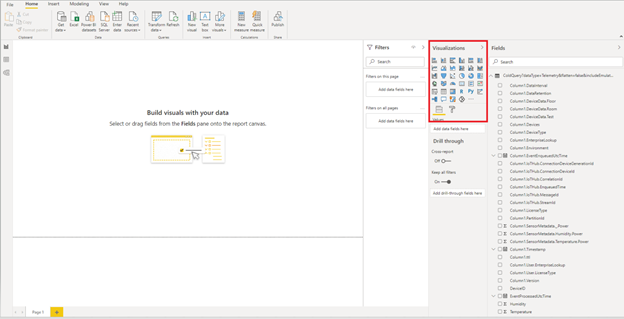
Visualize Data with Power BI
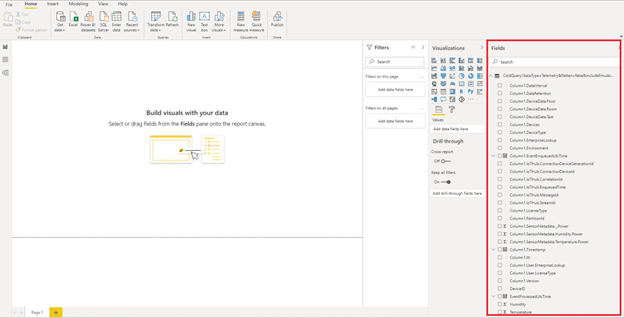
Now that you have transformed and loaded your data, it is time to prepare reports and visualizations for data interpretation and analysis. In the Fields pane on the right, you see the fields in the data model you just transformed and created.
Power BI can help you create compelling reports where you can change visualizations, customize colors or axes, apply filters, drag fields, and more! All these changes are fun to do, easy to undo, and quick to take effect. The Visualizations pane provides the tools necessary for adding and configuring multiple visualizations. Power BI has a growing list of visualizations you can download and use in your own reports that transforms complicated data into something easy to understand. This ease provides insights to make informed decisions quickly.
Additional information on how to visualize and bring your data to life can be located across the internet. You can get started on building your report and work through a quick 10 minute example to get you going.
